Why and How to Optimize Equipment Utilization Rates?

Time:2026-10-02 Author:Oliver
0%

Equipment utilization rates reveal how effectively a company converts machines, labor, and available hours into productive output. A low rate may indicate idle assets, frequent changeovers, maintenance delays, or weak production planning. A high rate is not always better. Overworked equipment can create defects, safety risks, and expensive breakdowns.

John Shook, former chairman of the Lean Enterprise Institute and a respected lean management expert, said, “There is no substitute for going to the gemba.” His observation remains practical. Managers should stand beside the machine, watch the operator, and record every interruption. A ten-minute delay may seem minor. Repeated across three shifts, it becomes a serious capacity loss.

This guide explains How To Optimize Equipment Utilization Rates through accurate measurement, preventive maintenance, smarter scheduling, and disciplined downtime analysis. It will examine key indicators such as availability, performance, quality, and overall equipment effectiveness. Real improvement begins with reliable data, not optimistic assumptions.

The process is not perfectly clean. Some losses are hidden in setup discussions, manual adjustments, or waiting for materials. Teams may also report numbers differently, which weakens comparisons. That problem deserves attention.

Practical optimization requires both technology and experience. Sensors can identify stoppages, but experienced operators often explain their real causes. A dashboard may show that a machine stopped at 10:42. The operator may reveal that its feeder had jammed for weeks.

Small details matter. A spare tool placed nearby, a clearer maintenance checklist, or a better changeover sequence can recover valuable hours. Yet every solution should be tested carefully, because improving utilization without protecting quality can produce misleading success.
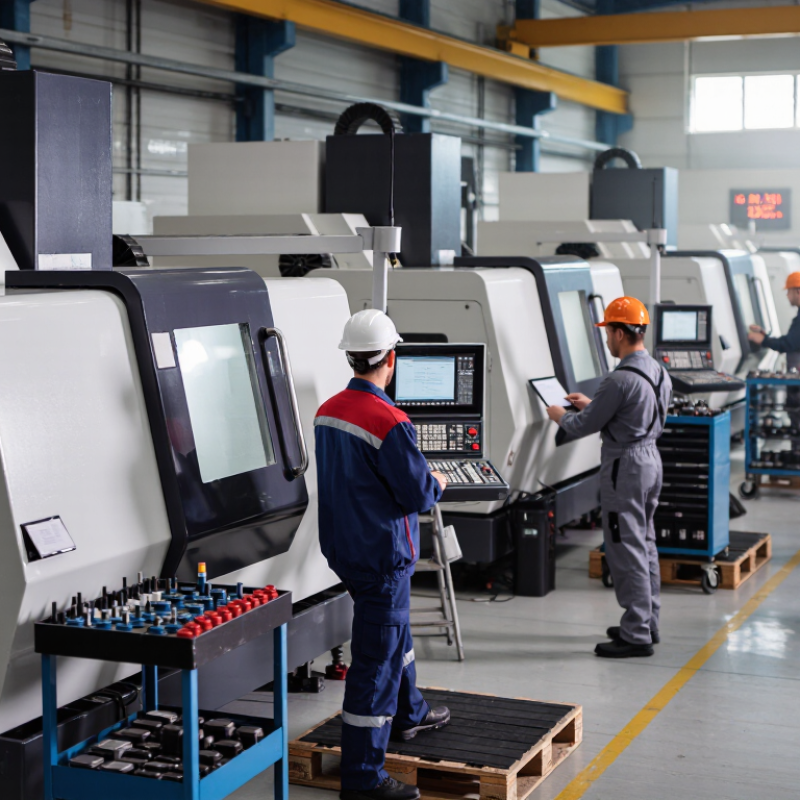
Why and How to Optimize Equipment Utilization Rates?

What Equipment Utilization Rates Mean and Why They Matter

Equipment utilization rate measures how much scheduled time an asset performs useful work. A common formula divides productive operating hours by available scheduled hours. An eight-hour shift with six productive hours equals 75 percent utilization. A simple calculation.

This rate matters because unused equipment still creates costs through space, labor, energy, and maintenance. However, a high rate is not automatically good. An overloaded machine may run continuously while producing defects, wasting power, or shortening component life. Reliable analysis should include output, downtime reasons, changeover time, quality results, and maintenance records. A machine can appear busy while waiting for materials or operator approval. That distinction often changes the decision.

Optimization begins with accurate, consistent data. Record when equipment runs, stops, waits, or receives planned service. Review the pattern weekly, not only at month-end. Shortening unnecessary changeovers may raise utilization, while preventive maintenance may temporarily lower it. That trade-off needs careful judgment. In practice, the first dashboard is rarely perfect. Sensors can miss brief stops, and staff may classify delays differently. Managers should check selected records on the production floor, compare them with system data, and adjust definitions. Practical improvements may include balanced schedules, faster material delivery, operator training, and maintenance planned around real workload. Higher utilization should support dependable output, not simply create a larger percentage.

Why and How to Optimize Equipment Utilization Rates? - What Equipment Utilization Rates Mean and Why They Matter
Operational utilization and OEE reference dashboard
Equipment utilization performance by asset category
Equipment Category Scheduled Hours Productive Hours Utilization Rate Availability Performance Quality OEE Optimization Priority
CNC Machining Centers 520 364 70.0% 92.0% 83.0% 98.0% 74.9% Reduce setup and changeover time
Injection Molding Machines 480 346 72.1% 95.0% 88.0% 97.0% 81.2% Improve cycle-time consistency
Packaging Lines 640 499 78.0% 94.0% 91.0% 99.0% 84.7% Balance workloads and eliminate minor stops
Industrial Pumps 416 274 65.9% 89.0% 79.0% 96.0% 67.5% Prioritize preventive maintenance
Forklifts 1,040 611 58.8% 96.0% 76.0% 99.0% 72.3% Improve dispatch planning and routing
Air Compressors 720 504 70.0% 98.0% 86.0% 99.0% 83.5% Match capacity to demand and reduce idle running
Welding Cells 480 322 67.1% 91.0% 82.0% 97.0% 72.5% Standardize work methods and staffing
Weighted Total 4,296 2,920 68.0% 93.4% 83.7% 98.0% 76.5% Focus first on low-utilization assets
Metric definitions and calculation basis
Utilization Rate = Productive Hours ÷ Scheduled Hours × 100. It shows how much of the planned equipment time generated productive work.
Availability = Operating Time ÷ Planned Production Time × 100.
Performance compares actual output speed with the designed or standard operating speed.
Quality = Good Units ÷ Total Units Produced × 100.
OEE = Availability × Performance × Quality. Percentages are calculated from unrounded values and rounded for display.

How to Measure Equipment Utilization Accurately

Equipment utilization shows how much scheduled time a machine actually performs useful work. Measure it with a clear time boundary, such as one shift or one week. Use this formula: productive running time divided by scheduled available time, multiplied by 100.

Use one definition. A machine running for eight hours is not automatically well utilized. Record startup delays, changeovers, maintenance, material shortages, and short stops separately. For example, an eight-hour shift may include 450 minutes of production, 25 minutes of cleaning, and 5 minutes of waiting. Its utilization is 450 divided by 480 scheduled minutes, or 93.8%, if all listed time belongs in the denominator.

The numbers looked healthy. Then the details changed the decision. A manual log missed several two-minute stops, while the operator counted slow running as production. I revised the calculation after comparing log entries with automatic runtime signals. I also checked rejected units, because producing defective parts should not inflate useful utilization. Review the data with operators, maintenance staff, and production supervisors. Their observations often explain gaps that sensors cannot. Avoid confusing utilization with efficiency or overall equipment effectiveness. Each metric answers a different question. Recheck the formula monthly, especially after schedule changes. Some measurements will remain imperfect. That is a reason to improve the method, not ignore the evidence.

What Causes Low Equipment Utilization Rates

Why and How to Optimize Equipment Utilization Rates?

What Causes Low Equipment Utilization Rates

Low equipment utilization rarely comes from one obvious failure. It often develops through small delays across the daily workflow. A machine may be available, yet remain idle between orders, inspections, or material deliveries.

In production reviews, I measure productive running time against planned available time. The definition matters. Some teams exclude maintenance hours, while others count every scheduled hour. Without one consistent method, the utilization rate can look better than reality. That is where analysis becomes unreliable.

Scheduling problems are a common cause. Operators may wait for instructions while equipment sits warm and ready. Long changeovers also reduce output, especially when tools, fixtures, or settings are not prepared nearby. A five-minute search can repeat ten times each shift.

Maintenance creates another hidden loss. Emergency repairs stop work suddenly, but neglected routine checks create slower performance first. Motors may run below normal speed. Sensors may trigger repeated stops. These details are easy to miss.

People and process gaps matter too. An operator who lacks training may avoid a machine during complex jobs. Poorly balanced production lines can leave one asset overloaded while another waits. Demand changes can create unused capacity as well.

Our first diagnosis is not always correct. A low rate may reflect weak scheduling data, not weak equipment. Reviewing downtime codes, shift notes, and actual cycle times usually reveals the difference. Photos of idle periods and short operator interviews can add useful context. Still, records are imperfect, so every result deserves a practical reality check.

How to Optimize Equipment Utilization Step by Step

Why and How to Optimize Equipment Utilization Rates?

How to Optimize Equipment Utilization Step by Step

Start with a seven-day baseline. Record operating hours, idle time, changeovers, breakdowns, and planned maintenance. A machine running for ten hours may produce value for only six. That difference needs evidence.

Next, separate losses by cause. Check an excavator waiting for operators, a forklift parked near a loading bay, or a cutting machine stopped for missing materials. Rank each loss by cost and frequency. McKinsey reports that predictive maintenance can reduce machine downtime by 30% to 50%. Begin with critical assets, not every asset.

Set a realistic utilization target. Full utilization sounds efficient, but it can remove maintenance time and increase failures. Schedule inspections during low-demand periods. Use sensors for temperature, vibration, energy use, and cycle counts. Compare live readings with the baseline each week. The U.S. Department of Energy notes that motor-driven systems consume a major share of industrial electricity, so energy data can reveal hidden idle capacity.

Review the results with operators. Their observations often expose delays that dashboards miss. One overlooked setup problem may explain repeated downtime. Correct the process, then measure again after thirty days. The first baseline may be imperfect. That is normal. Do not hide it. Management may also need to question whether utilization is the right metric, especially when quality or safety declines.

How to Monitor and Sustain Utilization Improvements

Equipment utilization improves only when it is measured consistently. Track operating time, planned downtime, unplanned stops, changeovers, speed losses, and rejected units. Use one definition across every shift.

ISO 22400 recommends structured manufacturing KPIs, including availability, performance, and quality. Without consistent definitions, a dashboard can look precise while hiding poor data.

A practical system records each stoppage at the machine, shift, and reason-code levels. A twelve-minute material wait should not disappear inside “idle time.” Review the largest losses daily, then validate them on the shop floor.

The U.S. Department of Energy’s Operations & Maintenance Best Practices Guide reports that preventive maintenance can reduce costs by 12% to 18% compared with reactive maintenance. Schedule inspections around actual failure patterns, not habit.

Sustaining gains requires visible ownership. Display weekly utilization, but also show data completeness and unresolved causes. A 2023 global smart manufacturing survey found that 86% of manufacturing leaders considered smart manufacturing important for future competitiveness.

Technology helps, but discipline matters more. Our first dashboard was too optimistic because operators entered broad downtime codes. We corrected the categories, yet some estimates remain imperfect. That is acceptable if the error is visible.

Recheck baselines monthly, coach supervisors, and adjust targets when product mix changes. Small reviews prevent temporary improvements from quietly fading.

FAQS

What does equipment utilization rate measure?

It measures productive operating time against scheduled available time. It shows how much planned time creates useful work. Not just activity.

How is equipment utilization calculated?

Divide productive running time by scheduled available time, then multiply by 100. An eight-hour shift with six productive hours equals 75 percent utilization.

What time should the calculation include?

Use one clear period, such as one shift or week. Record production, waiting, cleaning, changeovers, maintenance, and short stops separately.

Why can a high utilization rate mislead managers?

A busy machine may produce defects, waste energy, or wear components quickly. Waiting for materials can also look like productive activity.

What commonly causes low equipment utilization?

Frequent causes include poor scheduling, long changeovers, material shortages, unclear instructions, and emergency repairs. Small delays accumulate.

How can teams improve equipment utilization?

Prepare tools and fixtures near the machine. Improve material delivery, balance workloads, train operators, and schedule maintenance around real demand.

How can utilization data become more accurate?

Compare system records with operator notes and floor observations. Check automatic runtime signals against actual events. Sensors miss brief stops.

Should planned maintenance be avoided to raise utilization?

No. Planned maintenance may reduce utilization temporarily but prevent longer stoppages. The better target is dependable output, not a larger percentage.

Is utilization the same as efficiency or overall equipment effectiveness?

No. Utilization measures scheduled working time. Efficiency and overall equipment effectiveness answer different questions about speed, quality, and losses.

What should managers do when the data looks unusually healthy?

Recheck definitions, rejected units, cycle times, and short stops. The first dashboard may be wrong. That deserves honest review.

Conclusion

Equipment utilization rates show how effectively available machinery, vehicles, and other assets are being used compared with their full operating potential. Understanding this metric helps organizations identify idle capacity, improve scheduling, control operating costs, and make better investment decisions. Accurate measurement requires consistent data on available hours, actual operating time, downtime, maintenance periods, changeovers, and production results. Without reliable data, utilization figures may hide delays or create misleading conclusions.

How To Optimize Equipment Utilization Rates begins with identifying the main causes of underuse, such as poor planning, unplanned maintenance, operator shortages, inefficient workflows, or mismatched capacity and demand. Organizations can then improve schedules, coordinate resources, reduce setup time, strengthen preventive maintenance, train employees, and balance workloads across equipment. Finally, utilization should be monitored through clear performance indicators, regular reviews, and timely corrective actions. Continuous tracking ensures that improvements remain sustainable while preserving equipment reliability, product quality, and operational flexibility.

Oliver

Oliver

Oliver is a seasoned marketing professional with a wealth of expertise in driving brand awareness and engagement. With a deep understanding of our company's product offerings, he consistently delivers high-quality content that enriches our professional blog. His insights not only shed light on......